Friday, January 28, 2011

Genting, STI 28/1/2010


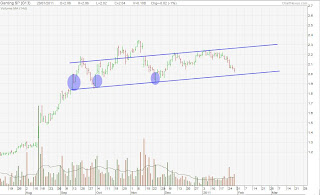
Genting Singapore: Big Operators are watching closely this trend. The selling pressure in Genting has not disappeared. Big Operators will emerge themselves next week with their activities as it is closer to the line of least resistance. By then, I have to judge how strong or how weak the buying is or if it will break the trend with more selling pressure.

STI: STI show signs of weak buying today as compared to the previous days. Could it be the end of the short covering or could it be a test for higher price to come? From the looks of it, higher prices are rejected. I would look to short today and see how much selling emerge. This is a tricky position because if it went down accordingly, it will be approaching the trend. However if not much selling is seen, i think the market will continue to run its course on the up side. If it breaks the longer term wedge, this could signal the start of a heavy downtrend.

Ronald K

GMG - A Super Syndicated Stock


I was curious to analyze GMG since so many people are punting on it and it created a frenzy on the exchange which caught my attention. In my opinion, GMG is a super syndicated stock. I will reveal why i said it is syndicated the next time, but i have my reasons for it. If you can study the operation of how the syndicates are playing this game, you are almost certainly to make profit each time by following their action.

In my opinion, the syndicates had taken almost 90% of their profit yesterday and the next 10% near today's high. The trading action today is bearish. Not only did the syndicates took profits, they started short selling. In the short term, this stock is coming down. There is no way it could go higher without any evidence of strong buying or accumulation. In the longer term, if i see somewhere along the line where the selling pressure has started to decrease, i will then follow the same syndicate activity for longing.

Ronald K

Thursday, January 27, 2011

Shanghai Stock Exchange - A Strong Rally in the Making


Shanghai Stock Exchange shows signs of very strong buying. I believe the whole selling and tiring process to wheel and deal the public had completed over the course of 2 months from Nov 2010 to Jan 2011. The public who had been depressed and disappointed dare not enter the market now because of the constant down trending of the SSE. In simple words, they had lost confidence.

SSE revealed signs of strong panic selling and accumulation which is of course good news for the market because it is due for a strong rally. Today marks the first day of a very strong buying. It tells me SSE is due for a very strong rally and any reaction is a buying opportunity. The SSE shouldn't drop any further. I shall continue to watch for higher highs and higher lows until i see culmination and that should mark the end of this rally that is about to begin.

Ronald K

Wednesday, January 26, 2011

Market Fraud and Why You Mustn't Trust Your Broker! A Must Read

WASHINGTON(MarketWatch) –

The Securities and Exchange Commission on Tuesday charged Merrill Lynch with securities fraud for "misusing customer order information" to place proprietary trades and for charging customers undisclosed trading fees. Merrill has agreed to a $10 million settlement for charging customers undisclosed trading fees, according to the SEC.

"Investors have the right to expect that their brokers won't misuse their order information," said SEC associate director Scott Friestad. "The conduct here was clearly inappropriate. Merrill's proprietary traders had improper access to information about the firm's customer orders, and misused it to place trades on the firm's behalf." Bank of America acquired Merrill Lynch with the assistance of government bailout dollars during the height of the financial crisis in 2008.

http://online.wsj.com/article/SB10001424052748704013604576104090997516476.html?ru=MKTW&mod=MKTW

Ronald K

Tuesday, January 25, 2011

What's next for Yangzijiang?


I must admit, i haven't been able to capitalized a lot of trading opportunities that the market showcased itself during this turbulent downtrend of the STI. I made some wrong calls, however i am able to justify those calls if anyone would to question me. On the brighter side, this downturn present yet another trading opportunity on the short side which i think would be fast and furious where one can make money fast.

Looking at the yzj stock, i managed to analyze and find trading ideas and opportunities that may present in coming days or weeks. Look at the horizontal lines, they represent lines of strong support which you should look out for strong buying if it present itself. (Only one line, which is the top line high above, it represents resistance.) These lines are also known as the Market Memory where price were previously held by big operators. When the market is falling and when those lines were reached, one should look out for evidence of operators activities. If the operators feel that prices are attractive at one of those lines, he would pronounced himself by his activity, else the bricks will continue to fall and support will continue to be breached.

Looking at the whole operation from late September - early October 2010, big operators managed to accumulate his inventory and by mid October, he managed to clear most of holdings so as to cash in profits and start purchasing for one final push. There is one area that i would like to touch on most. See the picture on the area where i wrote "Accumulation with weak rally effort". This is a very IMPORTANT point. During that elongated 20 days worth of accumulation and absorption of selling, it tells me that the operators are going to bring prices up very high because it will not be worth for their effort and time to accumulate for 20 days and just bring prices slightly above it's previous high and start short selling. This is a major indication of bad omen for any stock. And so true enough, on 13/1/2011, the sporadic action of yzj capered and pronounced itself, where operators were unloading and the public thought it was a breakout for buying more. The rest was history, the public got slaughtered for their ignorance.

For my trading plan in the coming days or weeks, i am looking for operators to cover shorts and cash in some profits before releasing more shorts. I will look to short once the short covering is over or until i see signs of strong buying which tells me to buy with the operators.

Ronald K

Sunday, January 23, 2011

Genting - Stock Pegging


I have not been blogging recently due to my research work into the exchange on big operator's behavior towards pegging. Pegging in my opinion is the fixing of prices at certain level which act as a stimulant and favoritism inclined towards the big operators than to the normal average investor.

In my honest opinion, nothing better illustrate the fact that the big operators are the end product of a system for pegging and manipulating of stock prices than the protean resourcefulness of the rationale he employs as he drops stocks 10 cents only at 1000,000 shares only then to revise this rationale so that another stock can be pegged at a fixed price of 2.17 for eighteen days while operators sell more than 20 million shares of it.

Add to this, big operators' great financial achievements when, in one of this most egregious breaches of manners, he drops prices and cleans out his holdings prior to a bull raid on the market; or, having committed himself to a prearranged plan, he raises prices, scares out the shorts, empties his accounts, and then sells short prior to dropping prices so that he can once again felicitously accumulate stock for his accounts.

Look at Genting, does it resembles some form of pegging action from big operators? The stock looks strong for set of higher prices to come. Looking at the way how Genting is having it's price pegged at an average price of 2.17, it tells me that the downside is limited and the potential for further breakout is imminent. I could be wrong, however i am just a firm believer that this stock is in a mode of absorption at the moment.

Ronald K

Thursday, January 20, 2011

Cosco trading halt? What is the rationale behind?


Cosco's action yesterday was too climatic and accordingly based on my analysis, it performed one of the most oldest tactic of a trading halt in the morning and gapped down on the second half in the afternoon. That's the by-product designed by the big operators! For those who were cajoled and hypnotized to buy on yesterday's breakout is now in a state of "cannot cut loss", and soon or later, they would be forced to liquidate their holdings if their trades are based on margin.

Today's trading halt served one purpose to the public who always confronted for the reason and has never received an answer:
Big Operators have virtually unlimited credit for emergency situations and equally important, access to as much borrowed stock as they many need. On occasions when the claims made on available supplies of stock are temporarily too great, trading is halt until big operators are able to locate more stock to borrow. So now you have the answer!

Today's borrowing of scripts is for shorting purposes and to curb the preponderance of public demand. The impasse reached by the public when the big operators are allowed to exploit the human nature and ignorance could not be more concisely summarized.

Ronald K

Wednesday, January 19, 2011

The Final Breakout in Cosco?


Almost everyone today in the trading lab have noticed the breakout in Cosco today and there was no surprise for me since I knew the reason for this long waited breakout. Cosco's breakout today was erratic and sporadic where in my opinion, in the short term trend, big operators had unloaded a great deal of stocks to the public. This is so typical by looking at the way they took the stock to a new high and how they managed to operate effulgently. A real buying doesn't looked like this. It involves absorbtion and multiple test before higher prices can be materialized.

The increased of supply for Cosco in my opinion is heavy where operators are looking to actively supply this stock to the unwary public's demand. I might be wrong and it might go higher tommorrow, however based on my analysis and the sporadic action of Cosco today, i strongly believe the upside is limited in the short term. This sporadic action is like a rubber band being stretched to it's maxixum length and then all the energy was suddenly released. For tomorrow's action, I shall monitor how much more demand is entering Cosco before taking a position on the opposite side or maybe supply will present itself?

Ronald K

Friday, January 14, 2011

Big Operators selling on STI 14/1/2011


Based on my analysis on the current STI, it seemed like Big Operators have already taken profits and started to short sell. The rally for the past 3 days looked sustain and the operators might be planning to give this rally one last boost to distribute more. For this rally to continue, signs of absorption would need to present itself it a clear and decisive manner. However based on observation, i still don't think STI's rally could sustain any longer. I might be wrong because anything can happen in the stock market.

For the near term trading, i would look to short sell. I would continue to watch for big blocks of shares at critical price levels. They revealed the true intentions of the big operators on whether a further rally should continue or the decline will take over and this will provide a clue on what to look out for in the bigger time frame.

Since operators had already distributed an enormous quantity of stock, it is inevitable that they would soon conduct a sharp decline. In fact, i believe traders/investors will be astonished at the speed with which STI is once again declined to the recent low.

Ronald K


Monday, January 10, 2011

The Dearth of Trading Ranges in Super Bull Market


Notice SGX rose from $7.4 to $10.2 without any obvious reactions for meaningful trading ranges? This is usually a sign of extreme speculation, which can end badly for those who arrive late, or those who get in early but continue to build on their positions, and for momentum players. Trading ranges are healthy and important, in that they allow the market participants to “catch their breath” and reevaluate value before proceeding onward.

Trading ranges create what are akin to “market memory.” Once a market begins to fall (or rise in the converse), previous trading ranges area will often provide some level of support (or resistance), serving to slow price down as market participants assess whether this area of previously accepted value is still relevant.

Without this trading ranges, there is no structure to support a market. Once a market begins to fall, for example, the trading ranges act like elevator stops - they may not completely stop the fall, but they will usually provide a pause in the downward auction that offers enough time for you to exit a trade, or at least judge where you are in the larger decline.

Look at the Kim Eng chart, does it offer some clue for a trading opportunity on the downside?

Ronald K

Sunday, January 9, 2011

The Esoteric Truth about Market Psychology vs Fundamental Analysis


We all face a continuous flow of conflicting information, and it’s easy to overweight the latest piece of information, or to choose just one of those pieces of information as the basis of a trade decision. History reveals that people aren’t very good at reaching accurate conclusions when enormously complex information must be analyzed and weighted correctly. We may be good at looking at each piece of information separately, but when it comes to relating each piece to the larger, cohesive whole, context is an elusive thing. Consider just a few of the myriad divergent information sources that can influence the performance of a market, sector, or single security at any given moment:
  • A company’s ability (or inability) to innovate
  • Earnings—rising, falling, or remaining static
  • PE multiples—expanding or contracting
  • Sales—expanding or contracting
  • Competitors—entering or exiting
  • Profit margins—expanding or contracting
  • Overall sector growth and acceptance
  • Global events
  • Analyst upgrades or downgrades
  • Money managers long or short on cash
  • Commodity prices—rising or falling
  • Interest rates—rising or falling
Every element on this list can exist anywhere on the scale of “relevant” to “immaterial,” depending on whether the market has correctly anticipated the future implications of that element. The bottom line: We are constantly bombarded with a mind-boggling amount of information, and the brain has a habit of filtering out everything except what is most self-serving. This process may make us temporarily comfortable, but when has comfort ever been associated with profitability?

That’s where the market psychology proves to be an invaluable tool, keeping us psychologically and intellectually honest. We may not be good at crunching enormously complex data, but we humans are exceptionally adapted at spotting possibilities, opportunities and integrating them into workable solutions. Market psychology proves by arranging the aggregate result of all these complex actions in a single, simple distribution curve.

Ronald K

Friday, January 7, 2011

The GOLD Rush, Has it cooled off?


I was monitoring quitely to see how GOLD is doing lately since everyone was talking about the gold rush. The media, internet, newspaper everywhere had been purporting that GOLD is going higher and higher. Looking closely at the daily chart, GOLD SEEMS to be in a distributed mode. It appears to have a triple top
pattern. Remember me mentioning not to look at patterns? I still hold up to that statement that understanding the force of supply and demand is critically vital as compared to recognizing patterns.

Why do i say that GOLD is in a distributed mode now? Because i saw supply constantly coming out to challenge the overwhelming demand. I am thinking that most of the public is afraid to buy GOLD now because the prices are too high and they are afraid that it will crash. This whole stock, forex, commodities market is a like a pyramid scheme. The lower you buy, you are safe because if prices moved up, you are emotionally statisfied. The higher you purchased, the fear of the pyramid collapsing increased exponentially, so its always wise to accumulate than chasing prices.

For the next few following sessions with GOLD. I shall continue to watch for more evidence of heavy selling and presence of weak demand to precisely determine the future trend of GOLD. For now, demand looks weak and bleak, but who knows? Anything can happen in the market!

Ronald K

Thursday, January 6, 2011

Market Phases - Buying vs Selling


See the above picture and understand the different market phases. I truly believe this is how all market works in the big picture. Of course, this will help midterm - longterm investors a great deal if they are able to see the market in a bigger context, as for being a short term trader, it's a whole new different ball game. Market phases are easy to identify in hindsight. But how do you identify them as they are developing? The art of distinguishing real-time market activity is more than a matter of drawing trendlines or using indicators on a chart. It takes time to acquire this skill, just as it takes time to learn to read an X-ray or master chess. With practice, however, you recognize the signs of balance and imbalance—perhaps the most essential element of successful trading. It’s easy to lose yourself in short-term minutia, which can cause you to lose track of the longer-term auction, therefore it is always advisable as a trader to see the bigger picture first before micro in into the context of fine details such as price, support/resistance, timeframe etc..

Have you ever wonder how does buying looked like? It all starts with accumulation, then markup, and finally climatic markup where prices are rising non stop. Envisage yourself when you were a baby, as you grew you first learnt to walk, then run and finally sprint. How do you identify buying in the bigger context? Buying is like climbing stairs step by step. This step by step climbing in the bigger context is accumulation. The market is climbing step by step until all the selling is absorbed and finally it's time to allow prices to sky rocket. Is buying the same as selling? The answer is NO. Buying takes time where selling takes speed.

Selling is the opposite of buying. Selling not is climbing steps by steps. Initially, during the distribution phase, the market needs time to slowly transfer the stock from the hands of the strong holders to the weak holders. Once the transfer process is completed, speed of selling sets in. Selling is a complete flush down of weak holders to scare them to liquidate their holdings. The rallies during the selling phases are mostly short coverings with some weak demand. Wouldn't you be scared when you hear bad news and prices are falling everyday? Do you dare to enter the market and buy? That's the purpose of the big operators, scaring the public and knock them off. Think of selling as a huge waterfall from the mountains. Of course, the market will come to a time where real strong demand sets in and for the market to rally again, it would require to absorb all the selling bit by bit before the bears turned bulls. This is how the analogy of Stairs vs Waterfall come about. Think about it.

Ronald K
Wednesday, January 5, 2011

US Dollar Index on a Rally?


I was looking at different charts this morning and the one chart which stands out of the pack was the US dollar index. Why so? Because it revealed signs of very strong buying and higher prices to come. The USD Index measures the performance of the US Dollar against a basket of currencies: EUR, JPY, GBP, CAD, CHF and SEK. With this in mind, is it time for the stock market to take a breather and allow the dollar to continue its rally? From the chart, it looks like that's the direction it's heading.

See the first small oval circle that i drew? That's a very powerful strong buying signal where big operators are buying agressively. Observe this chart to the previous BAC chart that i drew, they are almost 99% identical. I will not go on and write what the big operators were trying to do because that's already explained in the BAC chart. When you see this signal, just buy and close an eye, trust me your risk/reward will be astonishing.

The bigger oval circle constitutes of more accumlation in the bigger context in my opinion. The dollar had risen to a point where huge selling had manifest itself where it would require constant absorbtion of the selling for higher prices to continue. Over years, the dollar had been beaten quite heavily so now it's the time for it to take charge again. With BAC price rising agressively in the past two weeks or so, expect a similar chart paradigm to appear where it showed signs of fatigue for a period of time before it continues its uptrend.

Ronald K

Tuesday, January 4, 2011

Wilmar, bull campaign not ready yet.


Today something significant happened to Wilmar. Since the last post i blogged about Wilmar, Wilmar did indeed have a mild short rally. I saw demand came and that was why i was confident it will rally. Nevertheless, the last 2 days' action on Wilmar was pretty suspicious. The market rallied strong yesterday and Wilmar did not even rally much and that was a clue of weakness, where supply was overcoming demand.

Wilmar is now on its way to lower price and there will come a time again when demand will overcome supply. Wilmar definitely caught me by surprise because all along demand was in and i thought accumulation was taking place. For now, we know that the circled area is an area of distribution and it takes time for all the selling to finish before the buying will renew. We shall continue to watch and be cognizant of any impending changes that might developed.

Ronald K

Monday, January 3, 2011

Cosco, the start of a strong bull charging?


I was having conversation with a good friend of mine and he told me Cosco broke out today and that created an interest for me to study the operation of this stock. Between the period of 22/9/2010 to 27/10/2010, Cosco had been under a hidden accumulation phase for stronger price to come. For those who are using traditional indicators or other methods to trade the market, they would not be able to see this clearly or understand this phase. At first it looked like the market was having a huge correction, however under scrutinized observation, it was obvious that Cosco was on its high way to higher prices. How do i know? I will tell you if i ever have a stock course, it is not that clear cut and simple as it takes time for me to explain and for you to digest.

Once big operators had finished their purchased, Cosco was on its way for further up price as shown from 29/10/2010 - 9/11/2010. Once the target price was reached, the big operators knew that Cosco is a strong stock and they needed to purchase more, and so they took profit and flushed down the weak holders so that they could purchase more. Since big operators knew that this stock is a very strong stock, they are constantly checking for how much supply were there for this stock. They used different maneuvers to force the public into liquidation so that they could purchase more. This whole process is lengthy and a lot of time and effort is required. Trust me, their real intention is to purchase more of this stock because they know that it is a strong stock in the making.

So today you saw a breakout of the trading range of that huge area of accumulation? This is a real breakout created by the operators to lure the public into buying this stock. Can you see their real intentions? So today the public was in, and since they had accumulated a huge amount of this stock, they won't be letting it go all at once. They would churn more volume to create more public into this stock so that can slowly and quietly unload and take profits until there comes a time where it reached culmination and they would start short selling.

Check out this article by Collin Seow on his prediction on Cosco: http://www.sharesinv.com/articles/2010/12/31/trend-spotting-5/

For tomorrow and the next few days, i would wait for a reaction to enter a position in this stock. Do not chase, buy on weakness and sell on strength.

Ronald K

Saturday, January 1, 2011

STI, Start of another downturn?


The last post I blogged about STI having a reaction and nevertheless it did come on the very next day and the market acted accordingly to what i predicted. It's not that i am a genius or i can predict the future, but because the the market exudes signs of fatigue to continue its up move. I wouldn't put on my bearish point of view based on the action last Friday, instead i shall watch and monitor for more evidence in the next few days to validate the remaining strength of the rally.

Last Friday's closing was disappointing for many traders and investors as the year 2010 comes to an end. It left traders/investors with a lingering sense of trauma. Those who bought on the last 2 days were now wondering if they should continue to hold, cut loss or take some profits first. Prices have reached the top of the resistance and wasn't able to hold, therefore supply came in and put the unsuspecting public into a mind whirling mode. For next week, I will need to judge how much supply continues to appear and how much follow through develops after last Friday's closing. If Monday's closing is below last Friday's, this will increase my near term bearish view for STI from 30% to 50%. Otherwise, the market will continue its uptrend.

Ronald K